IBM Integration PoT Labs Home page
Discover the topic to use and filter events based on particular properties
For this scenario, you need a source of order events. A good place to discover sources of event streams to process is the catalog in Event Endpoint Management. When processing events, we can use filter operations to select a subset that we want to use. Filtering works on individual events in the stream.
1.1 Discover the topic to use
In these labs the instructor will act as the Event Endpoint Management administrator to expose the topics that students will need to complete the labs.
Event Endpoint Management provides the capability to describe and catalog your Kafka topics as event sources, and to share the details of the topics with application developers within the organization. Application developers can discover the event source and configure their applications to subscribe to the stream of events, providing self-service access to the message content from the event stream.
Access to the event sources are managed by the Event Gateway. The Event Gateway handles the incoming requests from applications to consume from a topic’s stream of events. The Event Gateway is independent of your Kafka clusters, making access control to topics possible without requiring any changes to your Kafka cluster configuration.
-
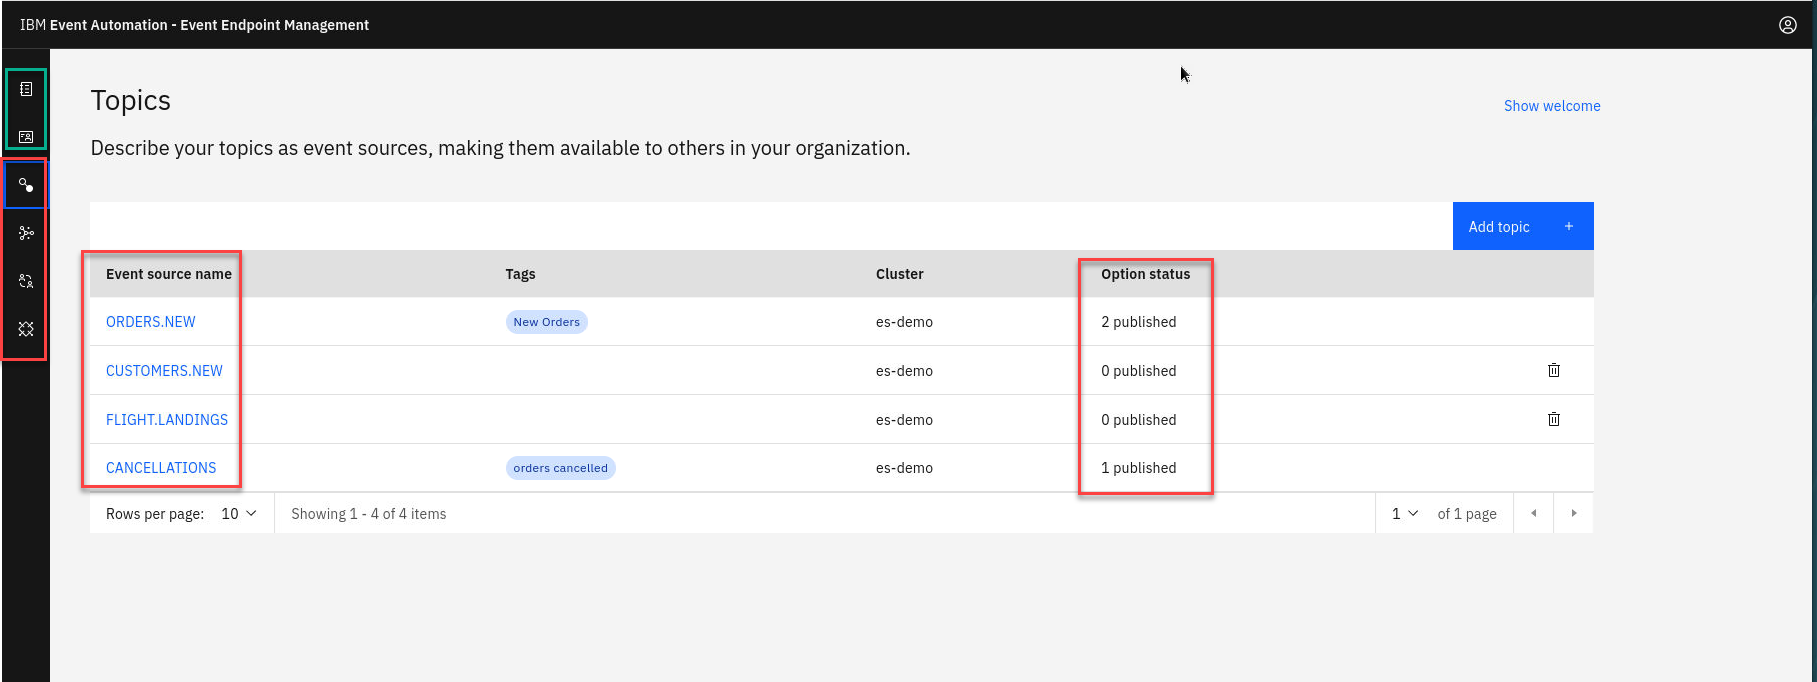
A quick review of Event Endpoint Management home page. The EEM administrator will manage the Topics, Clusters, and Event gateways Also will create the controls for topics and published the topics that will be visible to developers
-
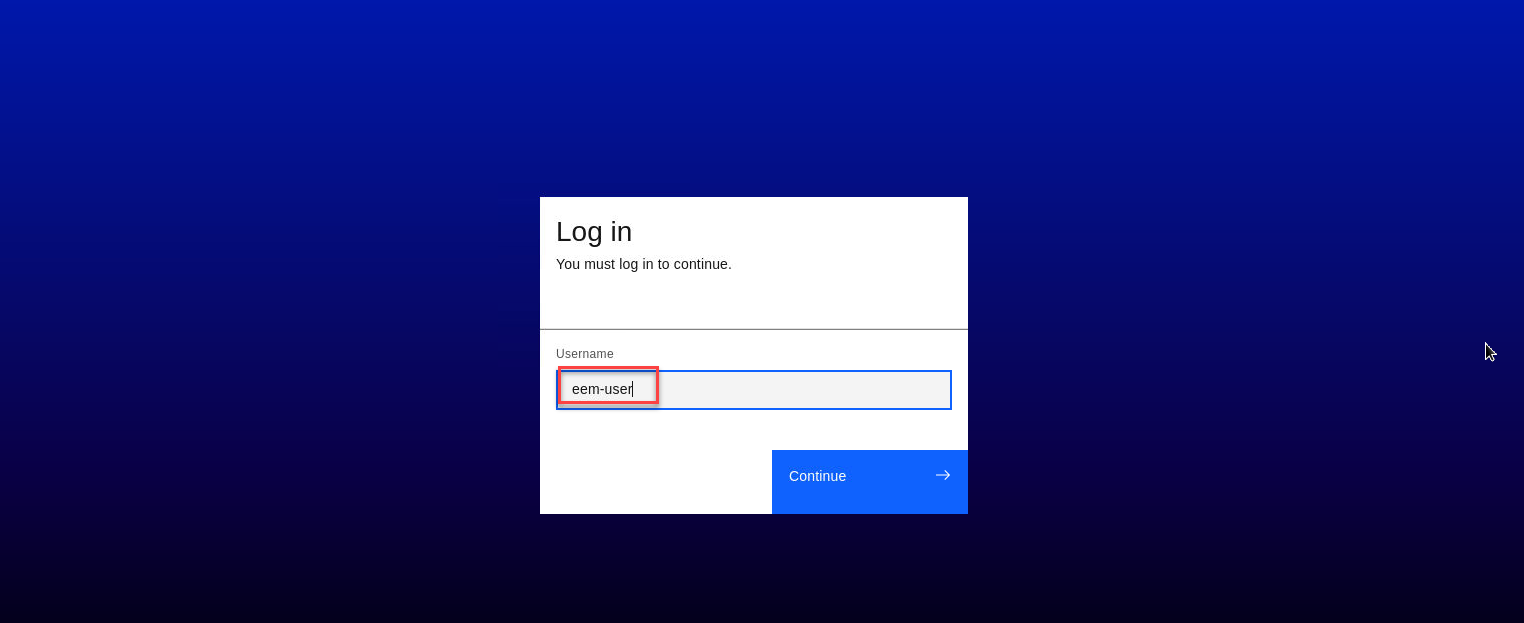
Login to the EEM home page as eem-user
-
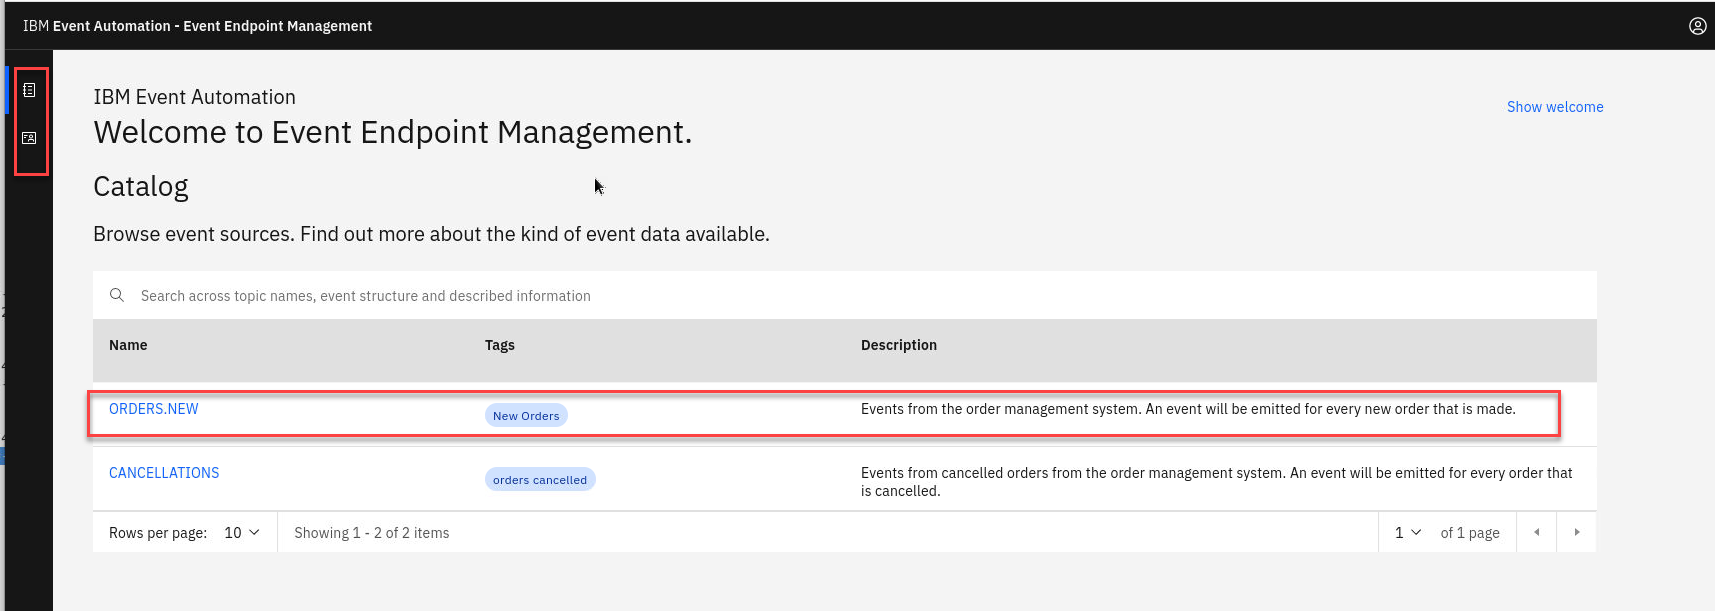
Go to the Event Endpoint Management catalog home page and find the ORDERS.NEW topic.
You will notice that as a user you will only have access to the Catolog page and Subscription page.
-
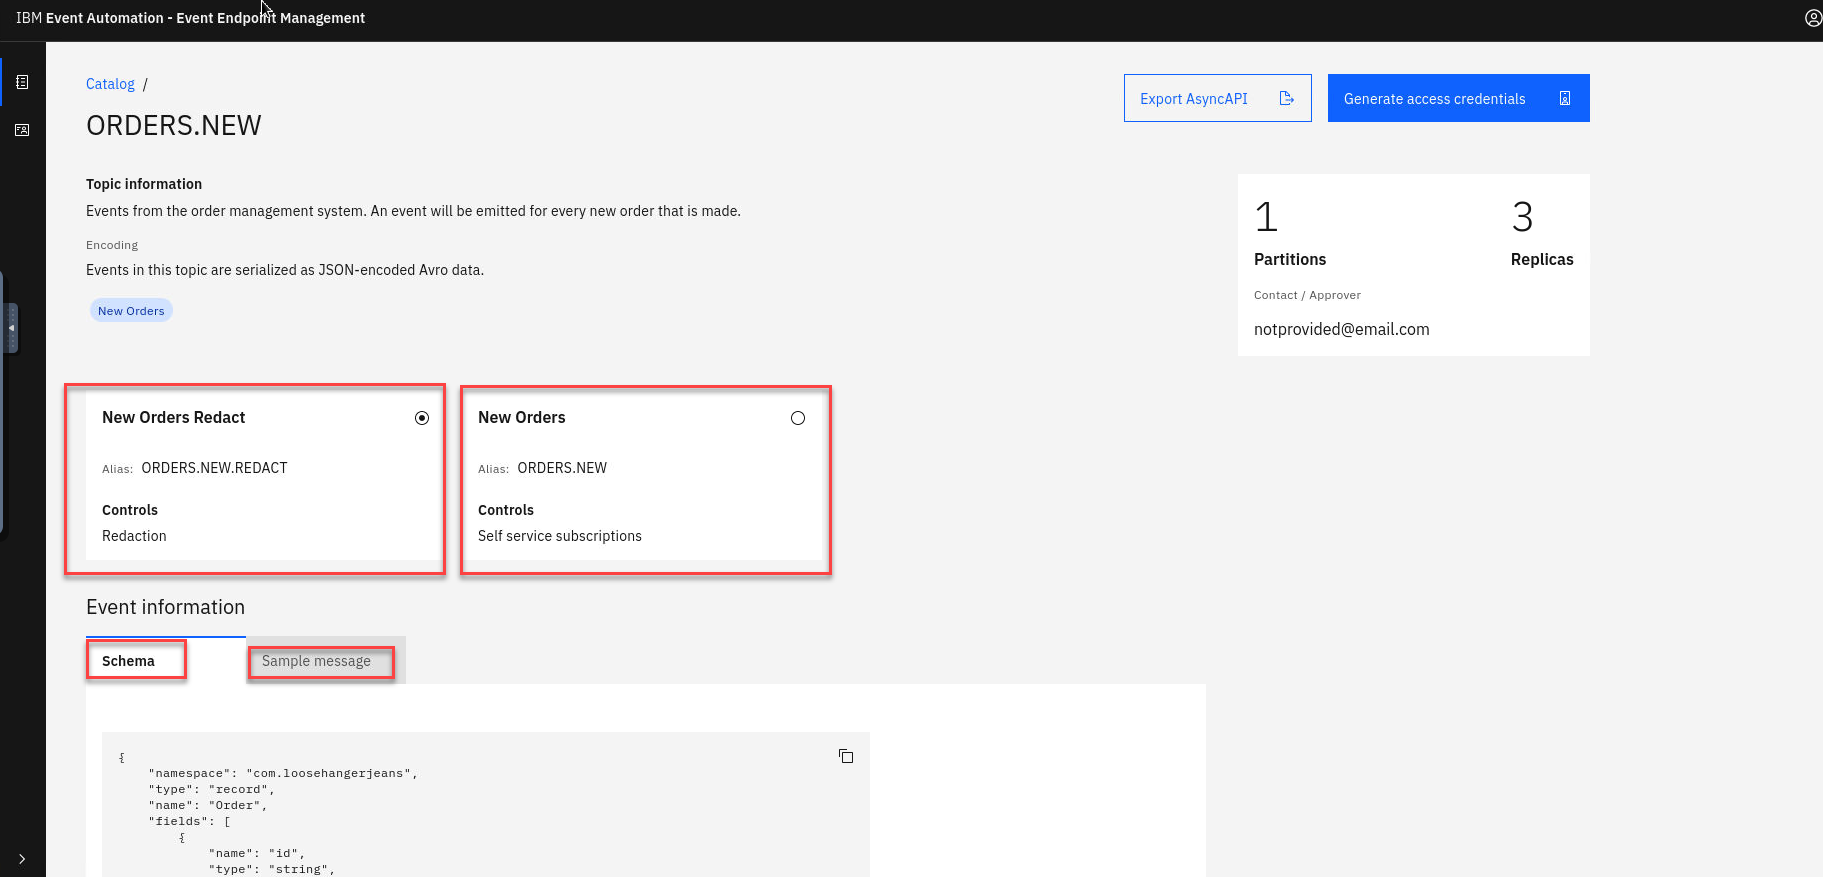
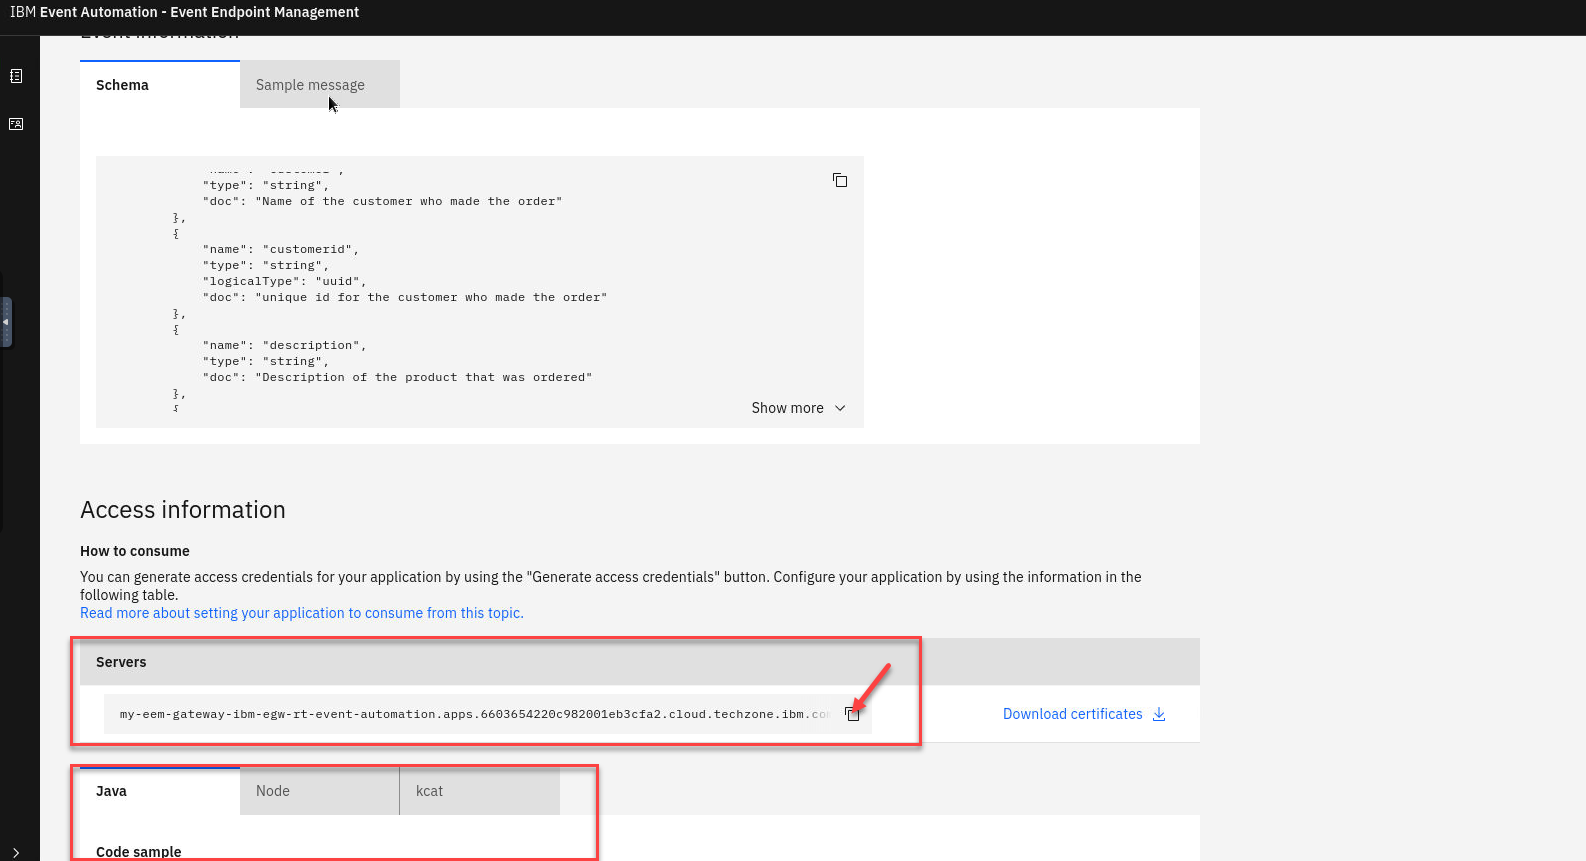
Click on the ORDERS.NEW topic to review the information about the events that are available here. Look at the schema to see the properties in the order events.
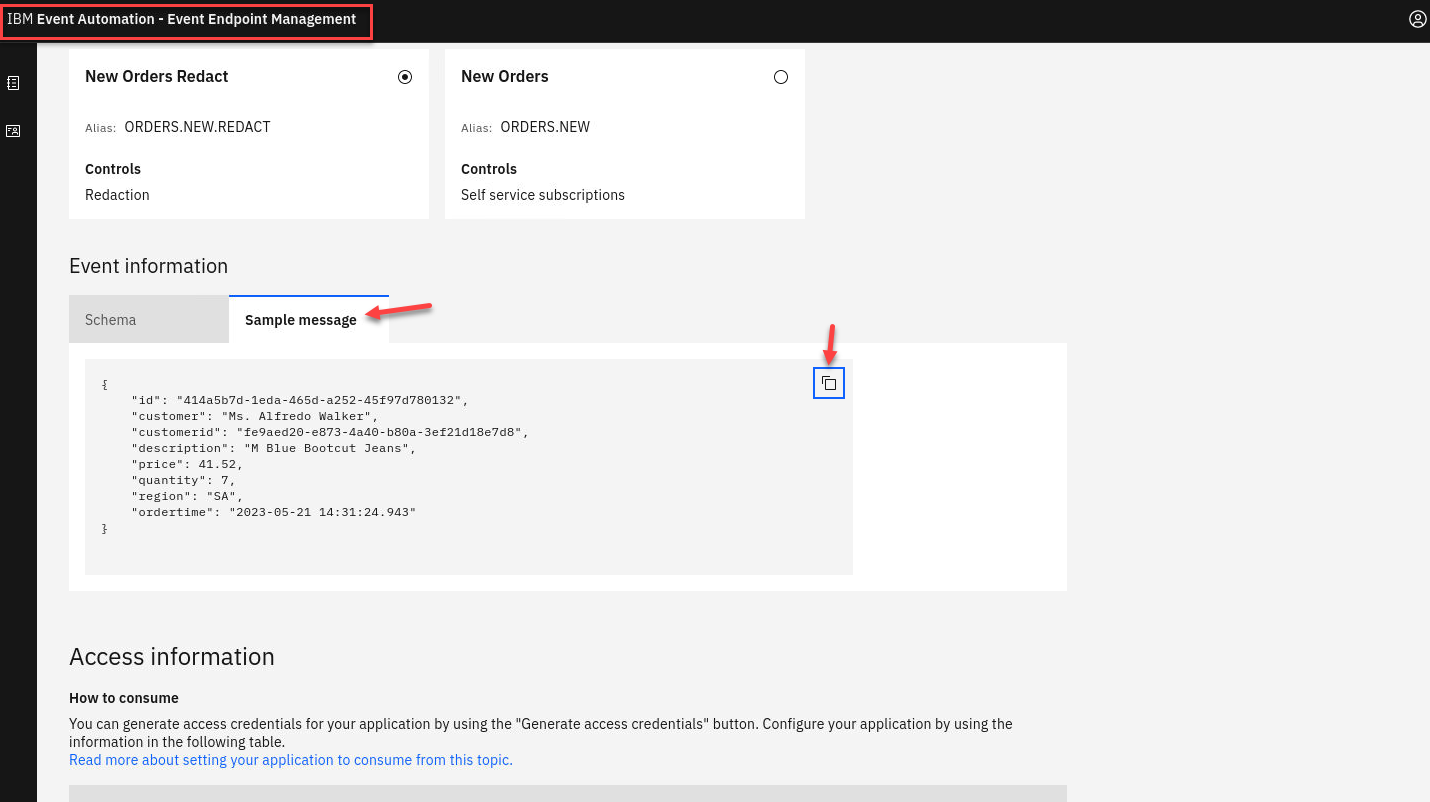
Will will also see what Controls have been created for this Topic. For the ORDERS.NEW we will be using the New Orders Control You can see the sample message to get an idea of what to expect from events on this topic.
 If you scroll down on the page you will see the Servers available that will be used in the Event Processing and also Code samples.
NOTE: Keep this page open. It is helpful to have the catalog available while you work on your event processing flows, as it allows you to refer to the documentation about the events as you work. Do the following steps in a separate browser window or tab.
-
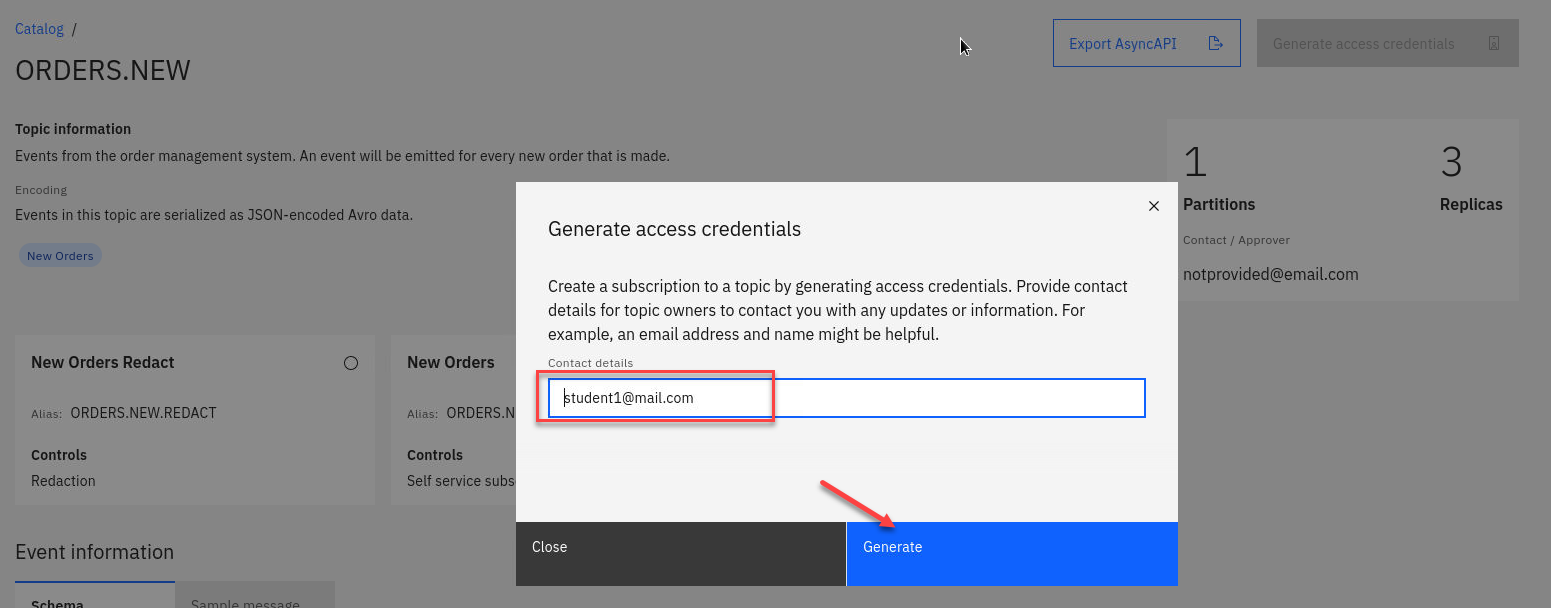
Click on the NEW ORDER Control topic and select the Generate access credentials in the upper right.

-
Here you will be asked for contact info. Enter something like a email or just your userid
For example student1@mail.com
Click on Generate.
-
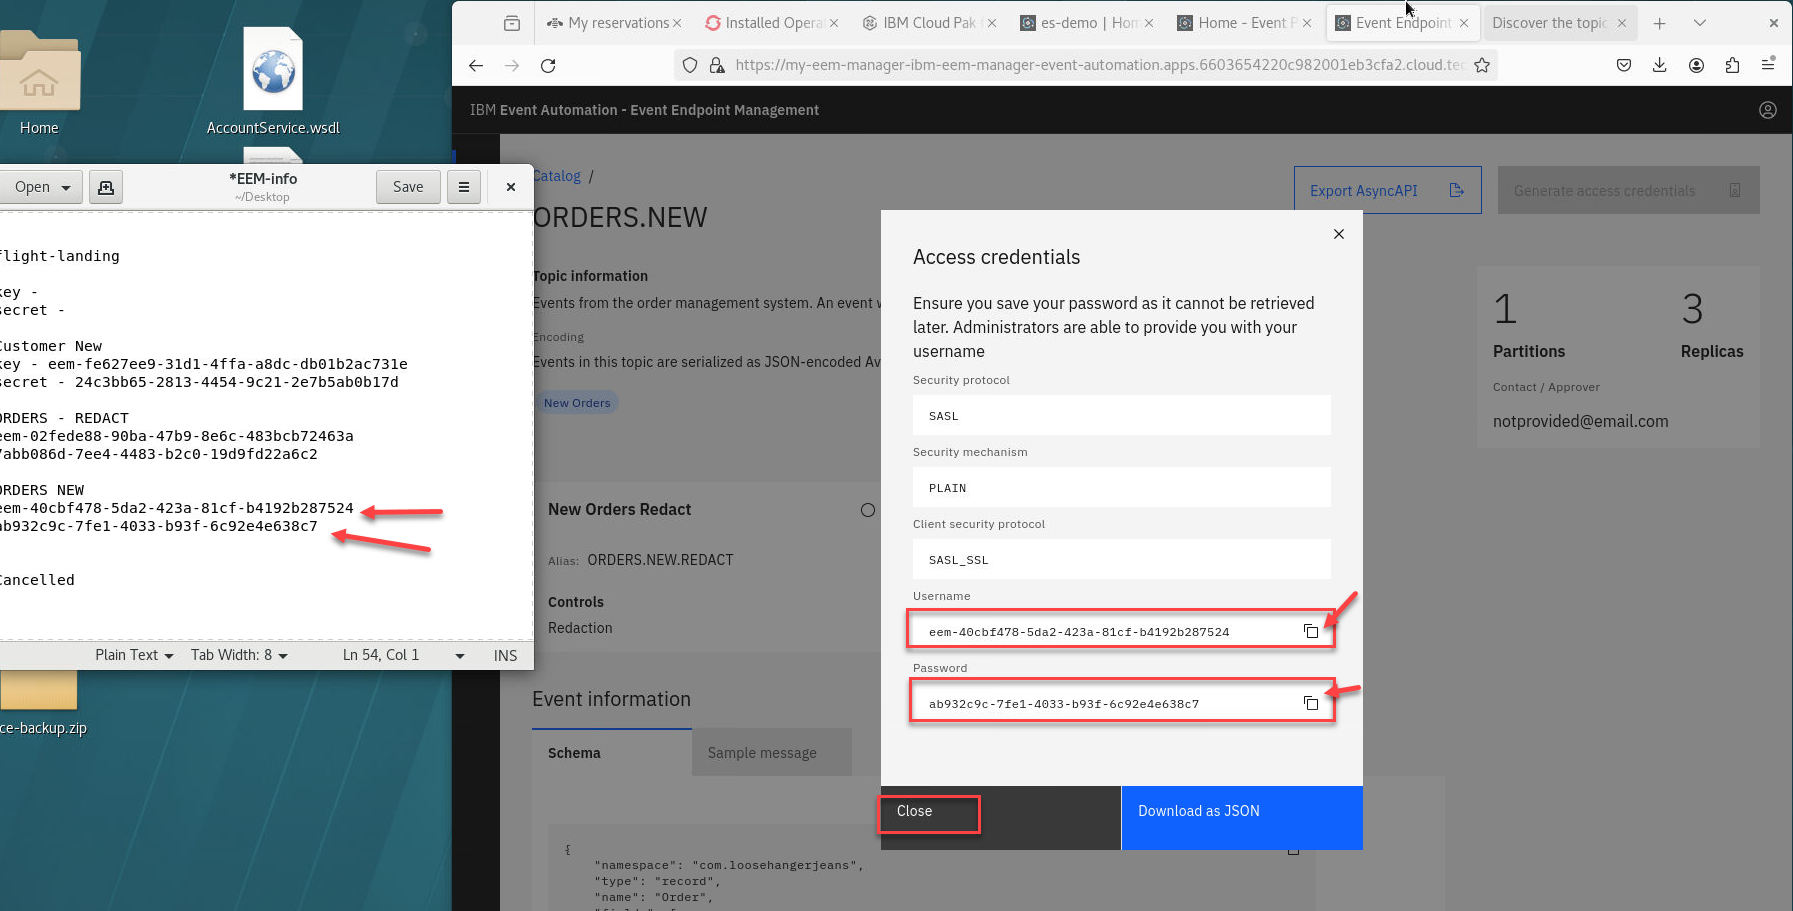
You will now see your Access Credentials. You will need to save these for later. On the Desktop if you open the EEM-info file that is a scratch pad to save credentials and other info for the labs.
Save the Username and Password under Orders New in the file.
1.2 Event Automation Processing
-
Go to the Event Automation Processing home page using the URL provided by the instructor.
The next step is to start processing this stream of events, to create a custom subset that contains the events that you are interested in.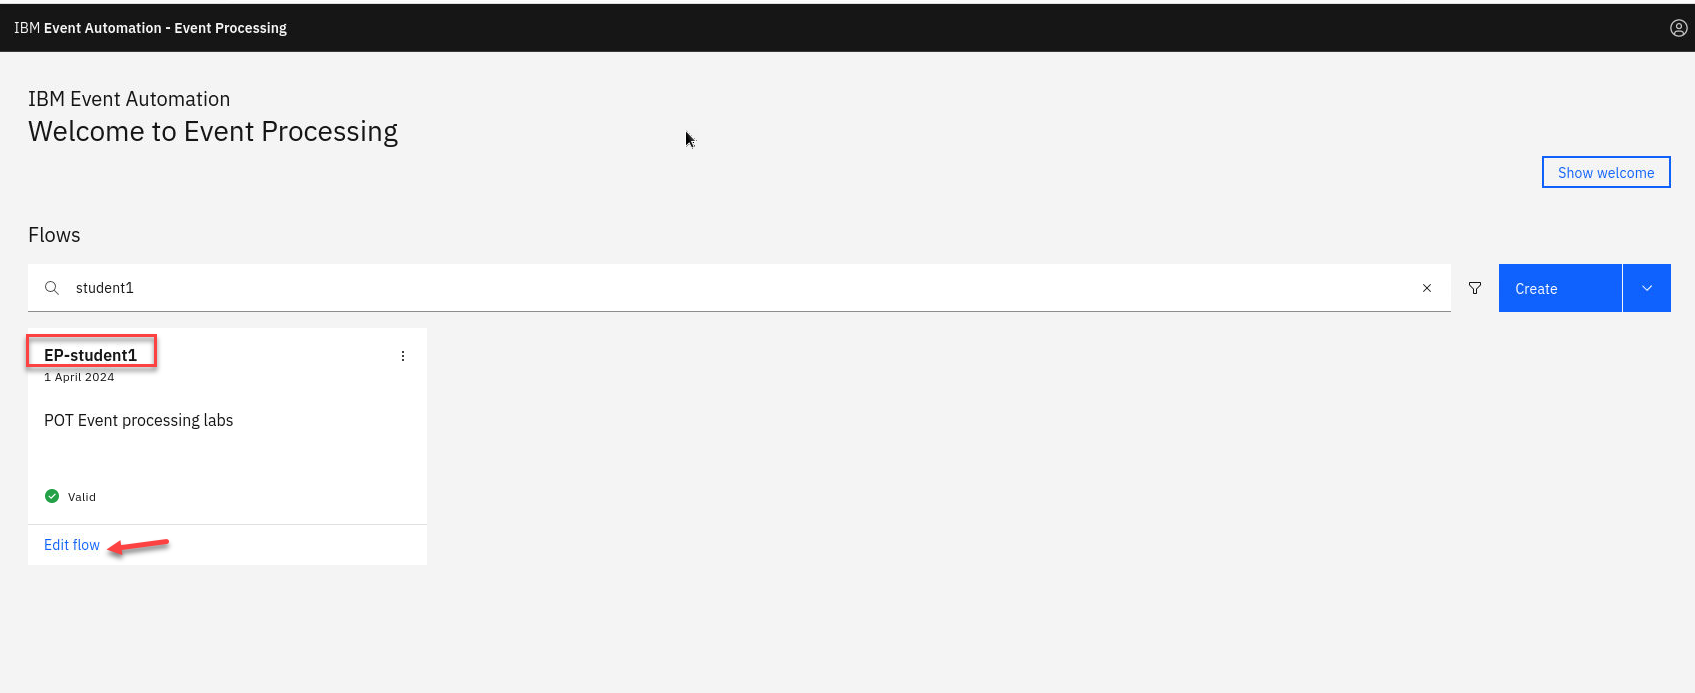
-
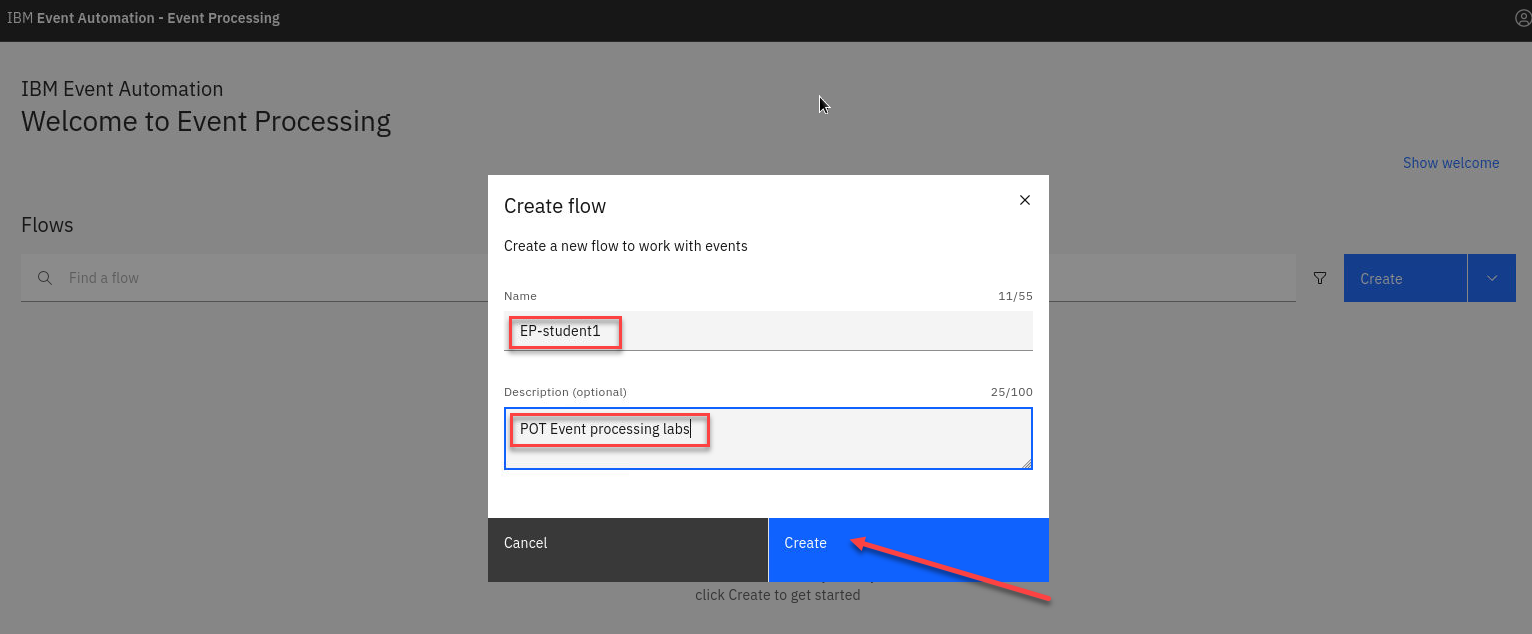
Create a flow, and give it a name and description to explain that you will use it to identify orders made in the North American (NA) region.
Name your Flow “EP-
" for example **EP-student1** And add a Description (ex: POT Event processing lab)
Click Create
The next step is to bring the stream of events you discovered in the catalog into Event Processing.
-
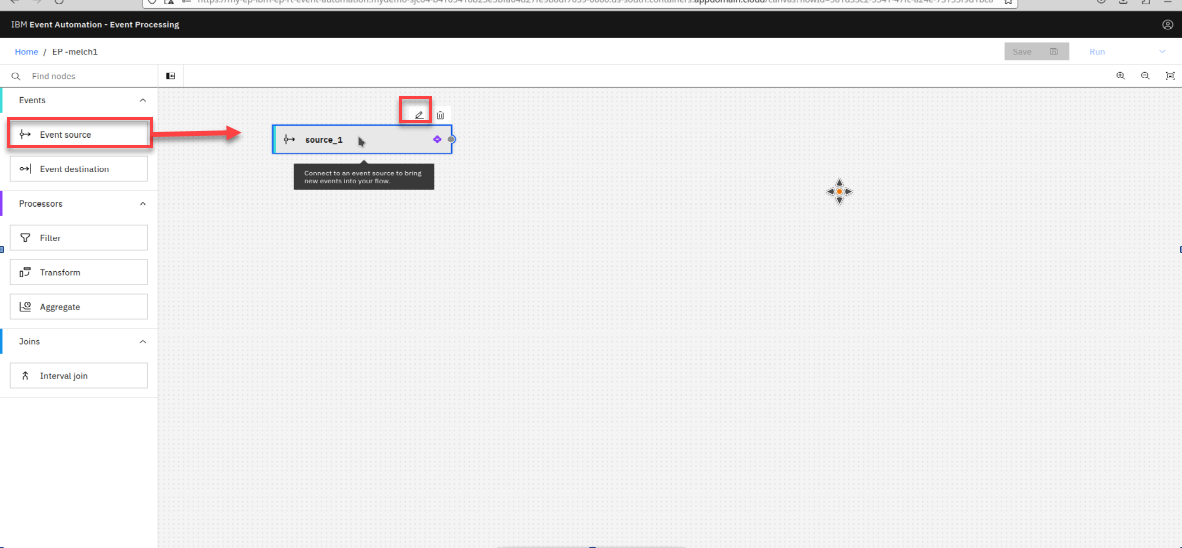
You will know be on the canvas. Create an event source node by dragging one onto the canvas. You can find this in the “Events” section of the left panel. To configure the event source node hover over the node and select the pen icon.
-
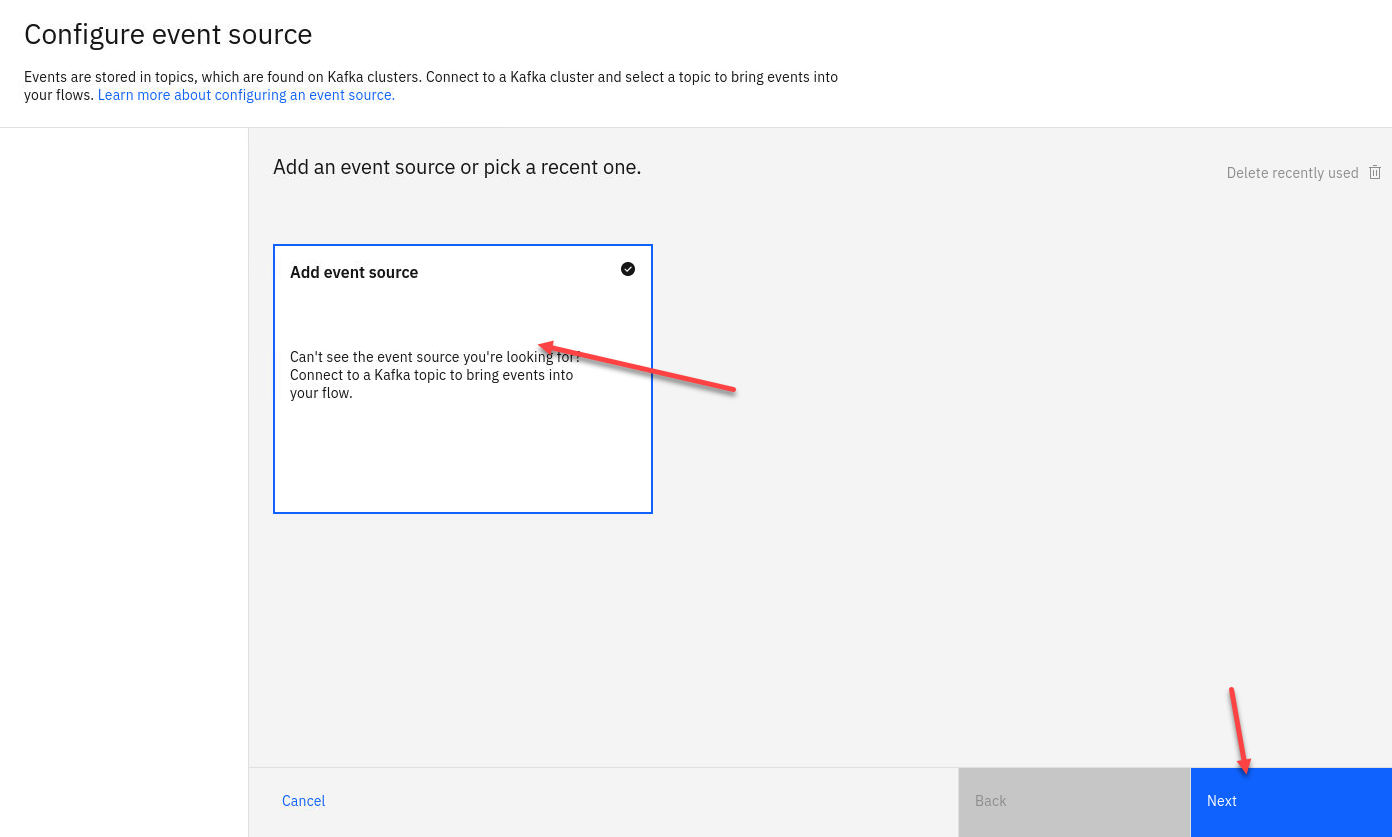
Configure the new event source. Make sure to use the Add event source. You may see others that were recently created.
-
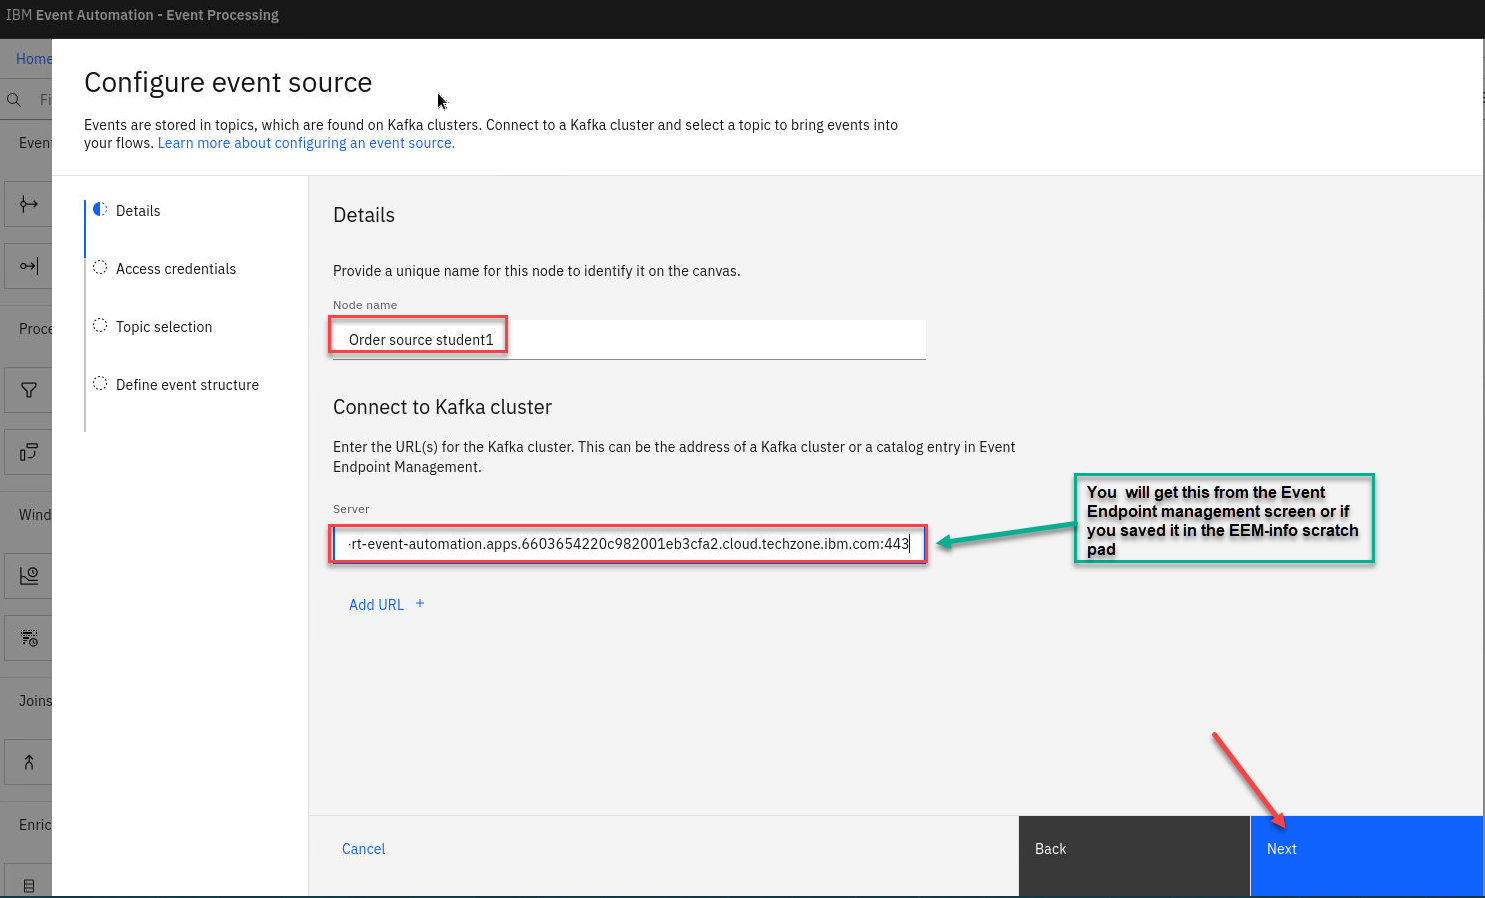
Give the node a name that describes this stream of events and include your userid for ex:
Order source student1
We need to get the server address from Event Endpoint Management
-
Now go back to the Event Endpoint Management home page (should be open in another tab). Here we will copy the Server that we need to complete the Source Connector.
-
Now return to the Event Processing to finish configuring the event source for our flow. Paste the url in the server and click Next
Note: Save this in the EEM-info scratch pad so you have it later.
-
Now we will accept the certificates.
Click the Accept certificate box and click Next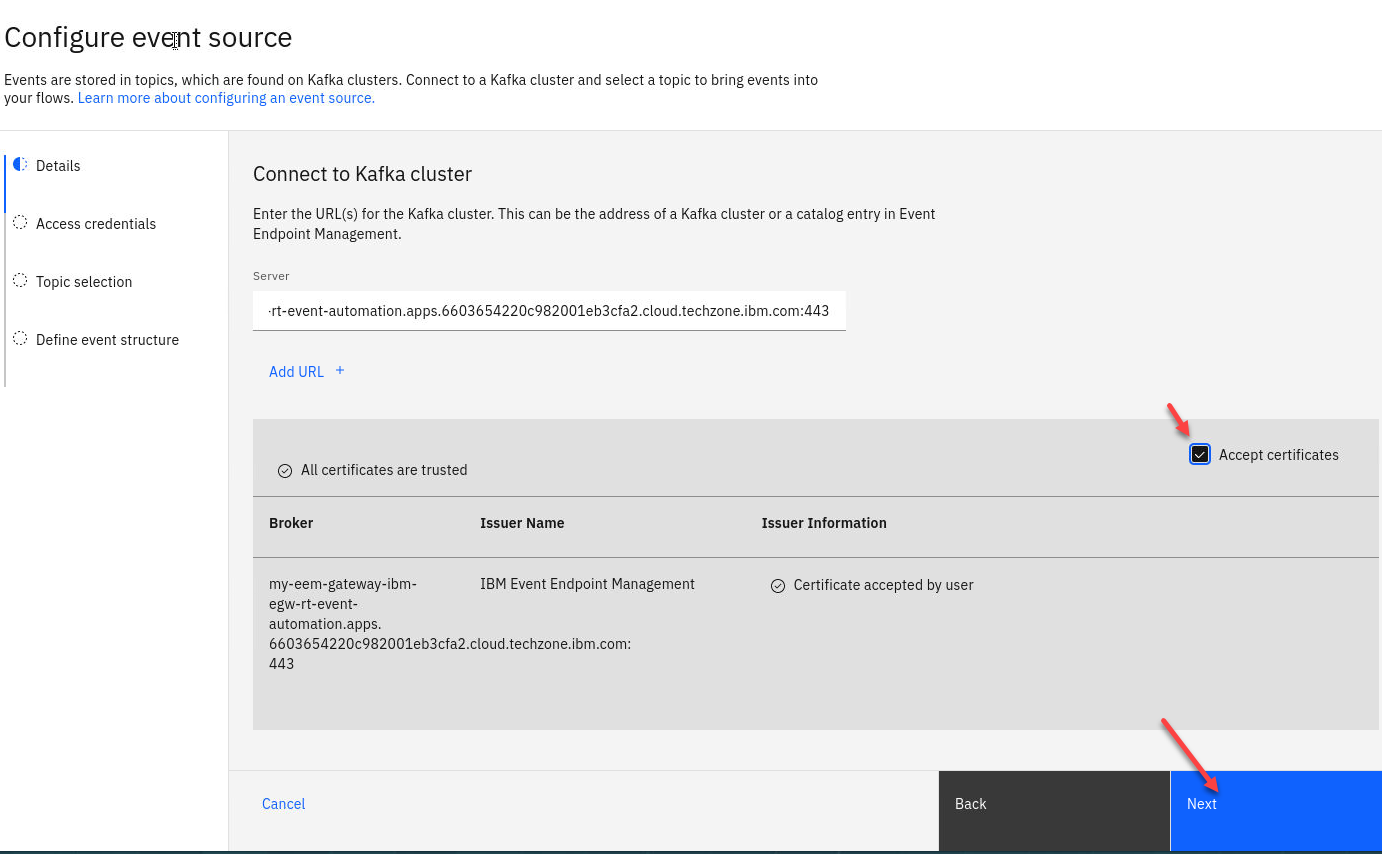
NOTE:: If the credentials are not accepted immediately, wait for thirty seconds, and then click “Next” again.
-
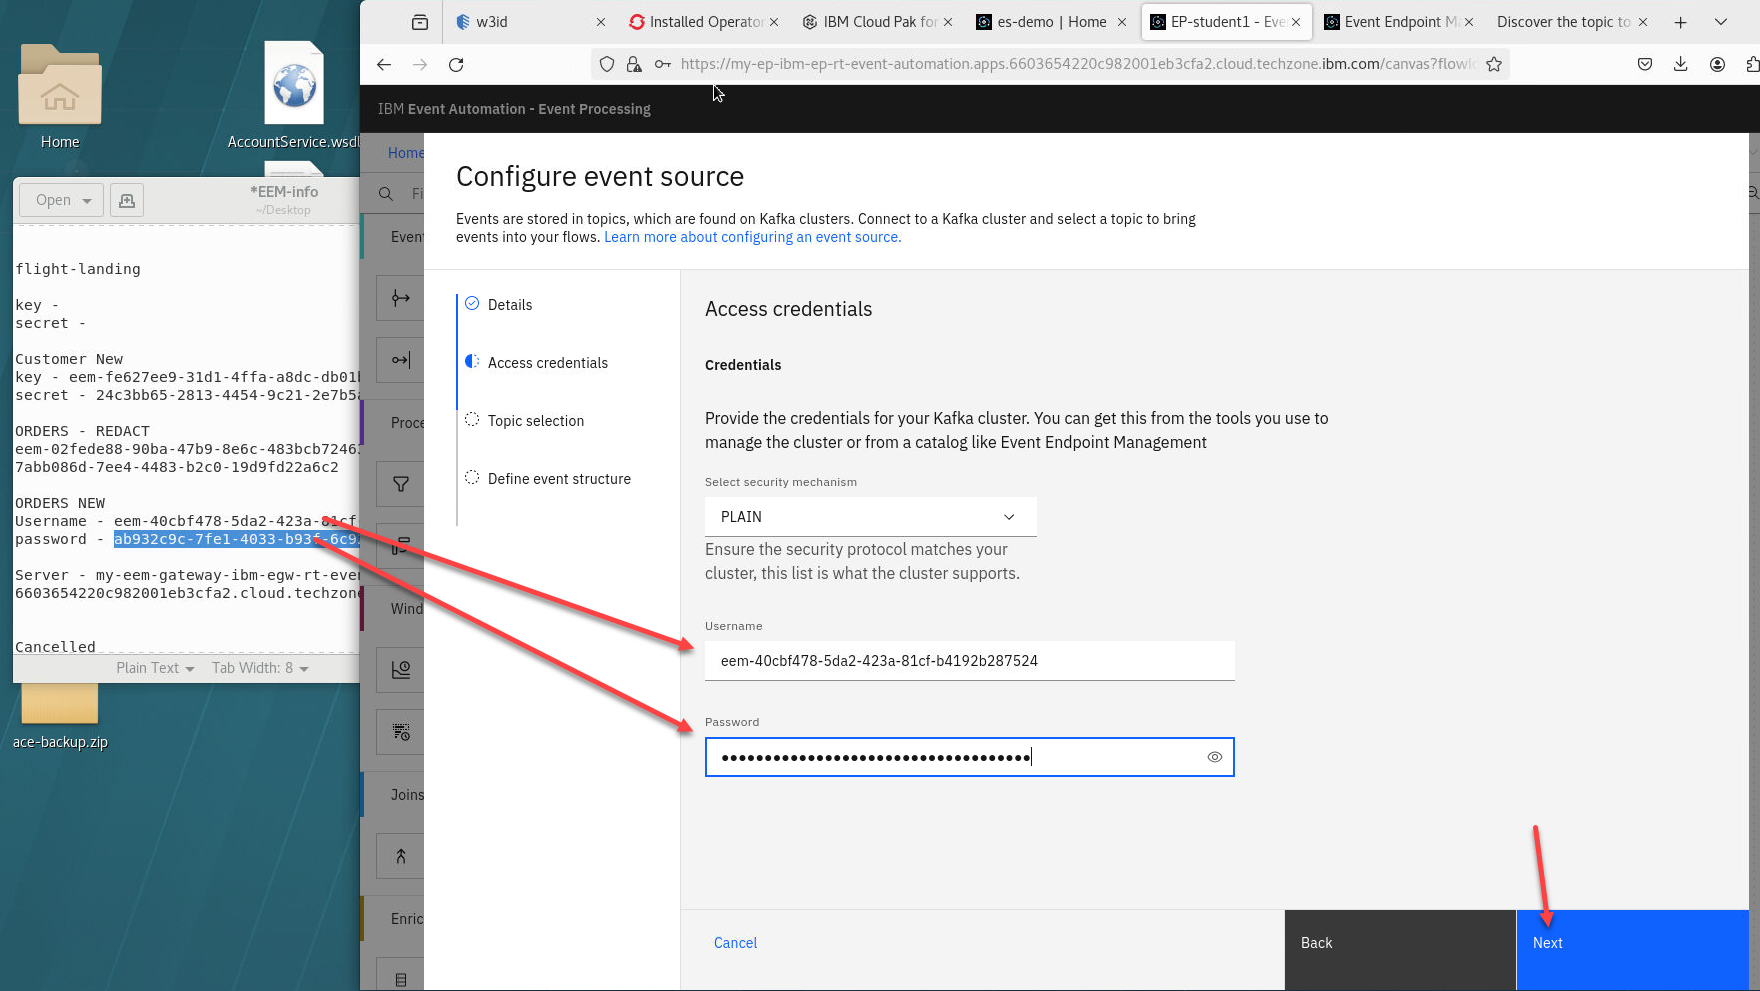
Now we will add the username and password that you saved from the Event Endpoint Management.
Click Next
-
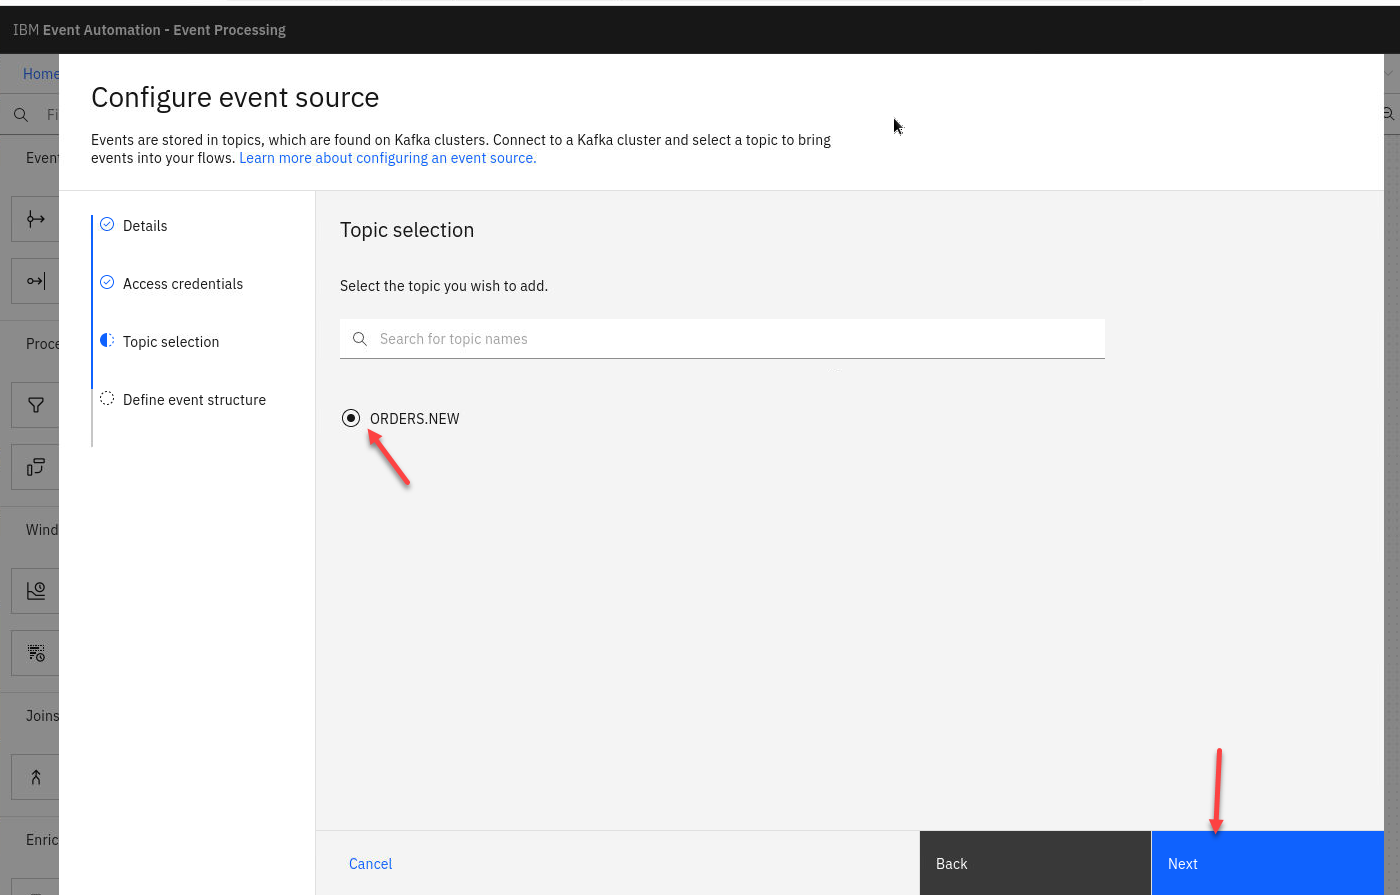
Now select the Topic we will use. ORDERS.NEW
-
Get the schema for order events from Event Endpoint Management.
Click the Copy button in the Sample message tab to copy to the clipboard.
-
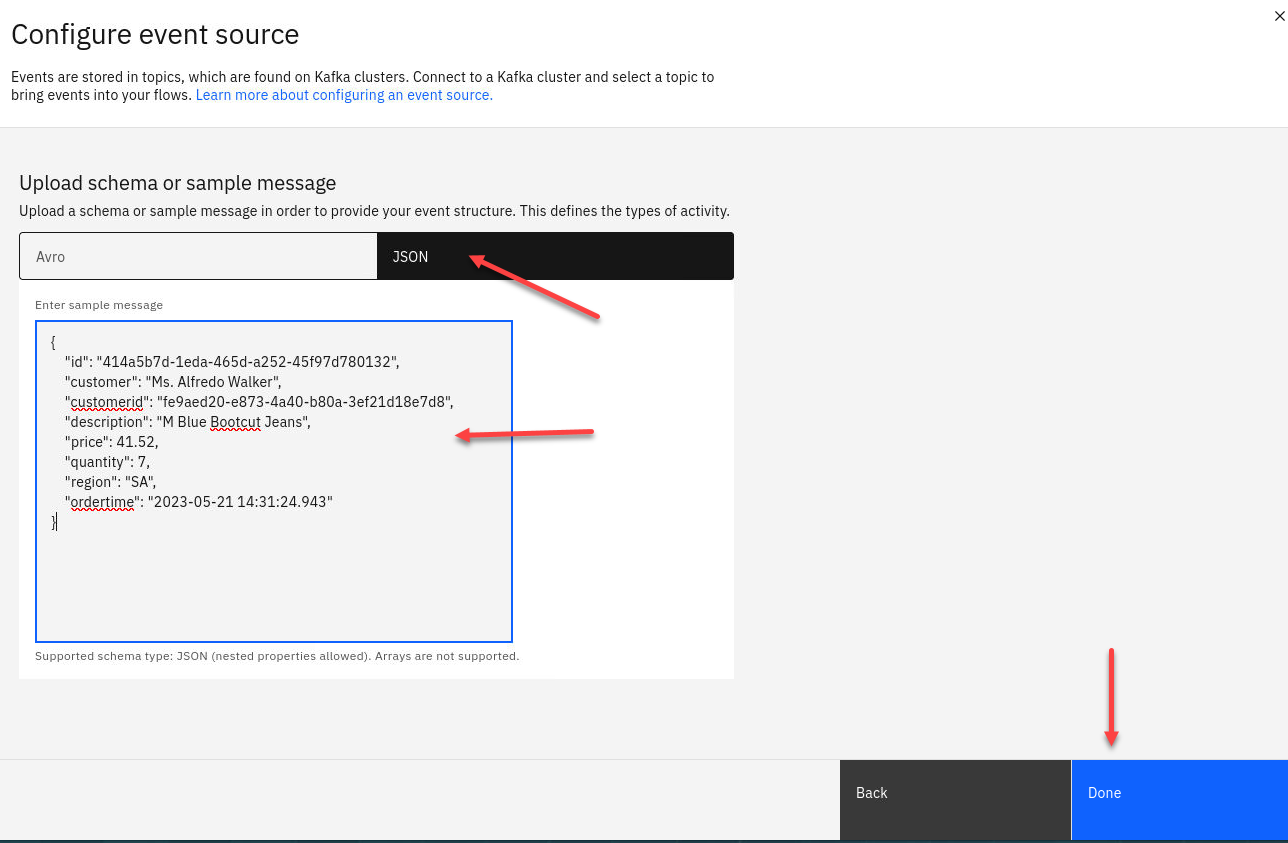
You need to give Event Processing a description of the events available from the topic. The information in the sample message will enable Event Processing to give guidance for creating event processing nodes. Back on the Configure event source screen select the JSON tab and paste the sample message here.
Click Done
-
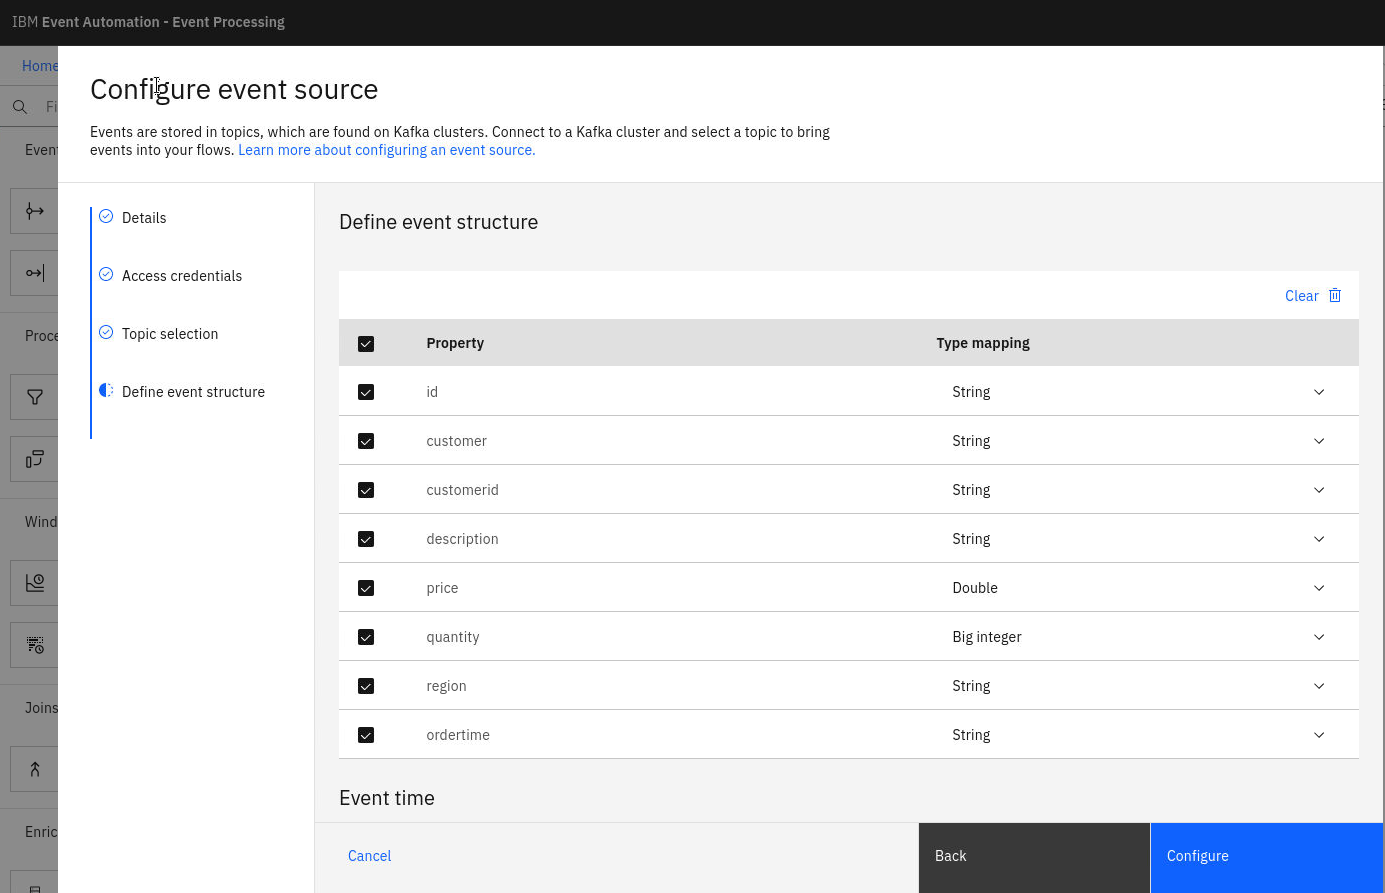
You will now see the structure of all fields for the source. Scroll down to the bottom of this screen.
-
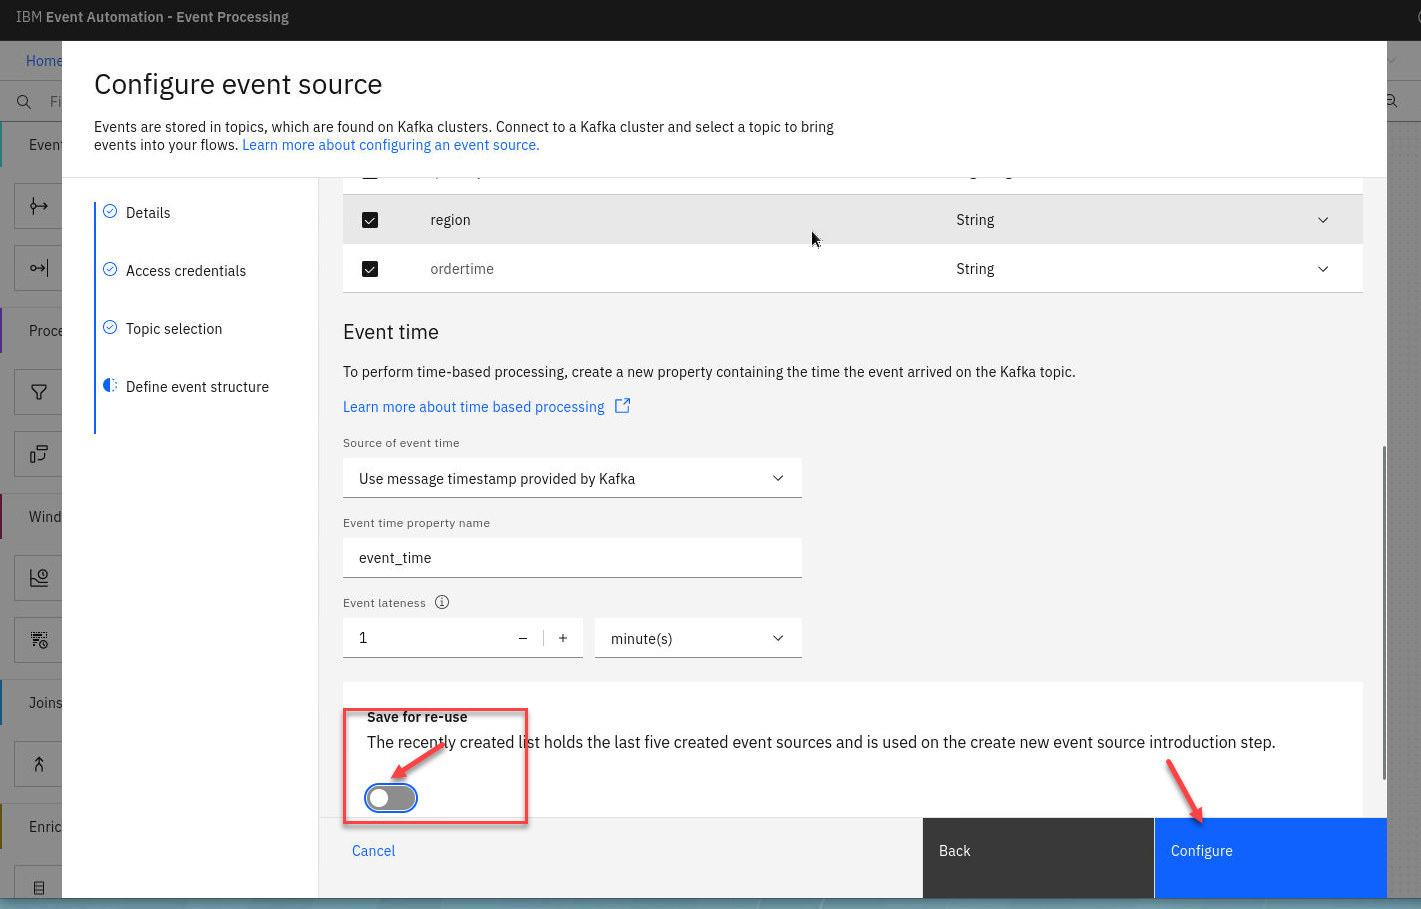
You will see switch make sure it is clicked off. We will not need to save this.
Click Configure to finalize the event source.
-
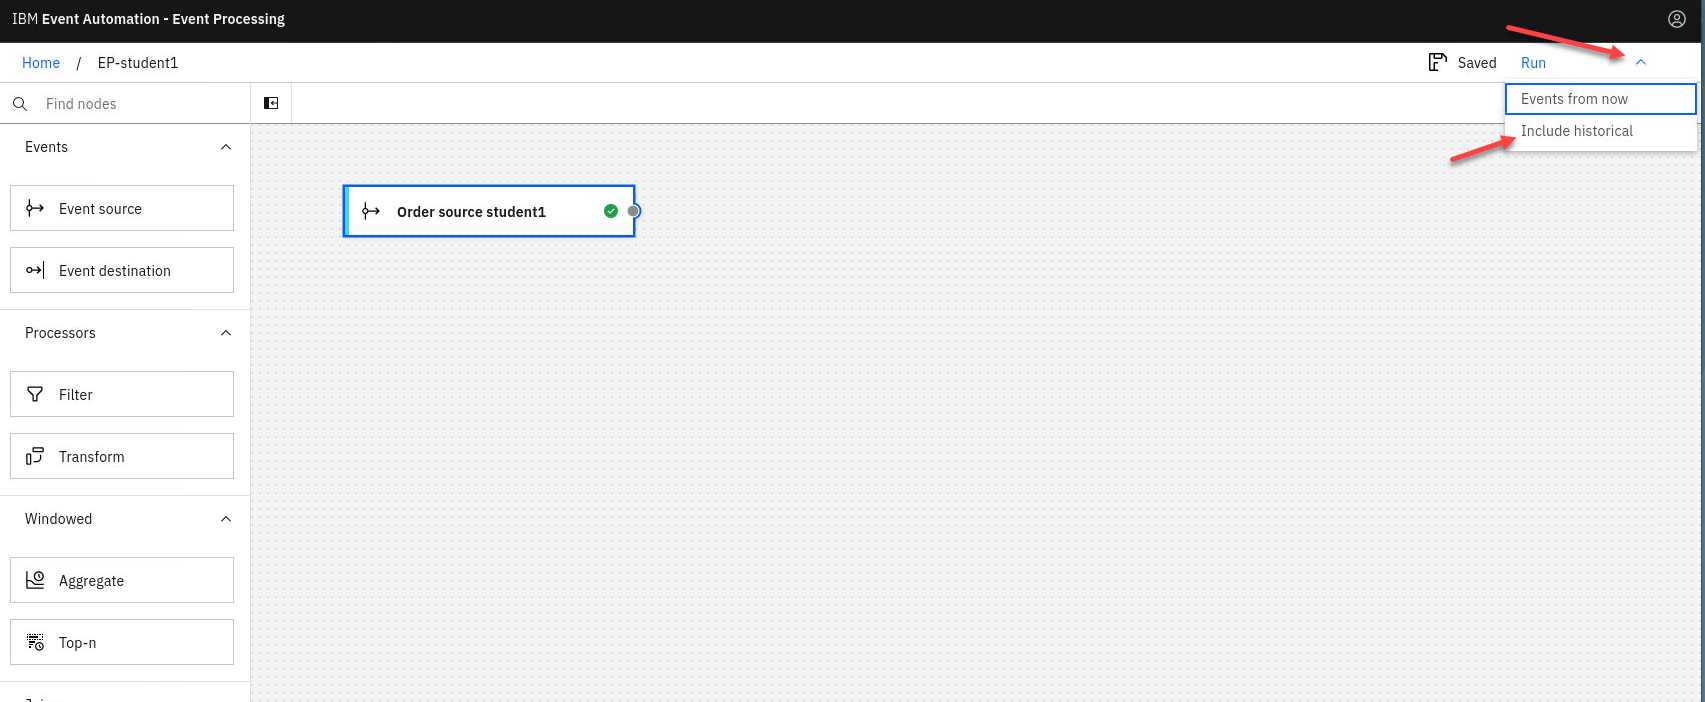
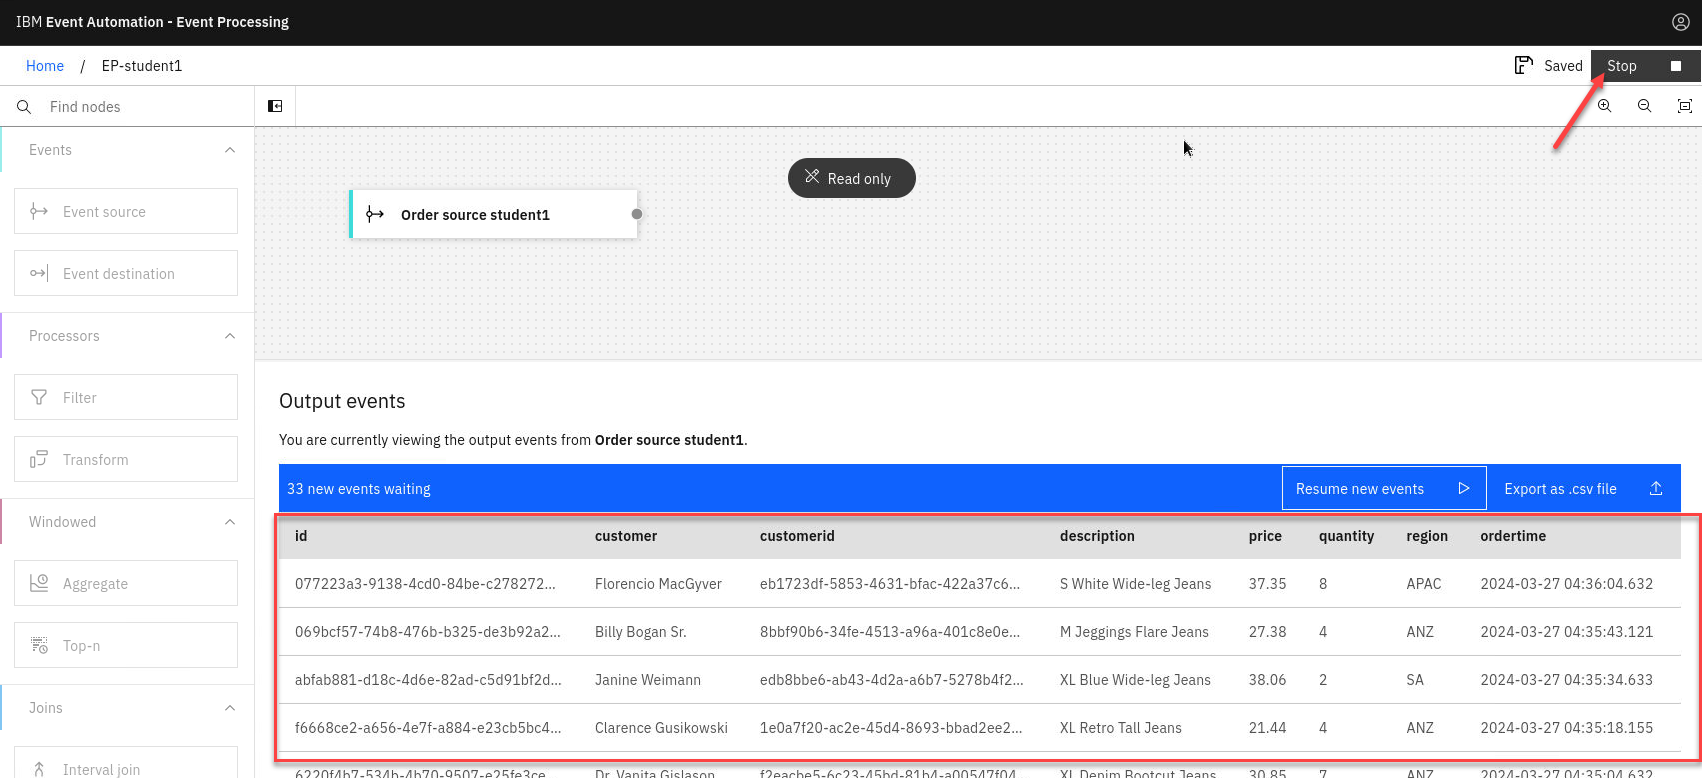
Now let’s do a quick test to make sure are Source Connector can receive messages. Click on the Run in upper right corner and select Include historical.
-
Once the Flink task starts you will start to see messages displayed.
Click stop in the upper right corner to stop it.
Recap
You created your first event processing flow. You have seen how to discover and request access to a topic in the catalog, and register it as a source of events for processing.
2.0 Filter events based on particular properties
When processing events, we can use filter operations to select a subset that we want to use. Filtering works on individual events in the stream.
Scenario : Identify orders from a specific region
The EMEA operations team wants to move away from reviewing quarterly sales reports and be able to review orders in their region as they occur. Identifying large orders as they occur will help the team identify changes that are needed in sales forecasts much earlier. These results can also be fed back into their manufacturing cycle so they can better respond to demand.
Define the filter
The next step is to start processing this stream of events, by creating the filter that will select the custom subset with the events that you are interested in.
-
If you are still in the Event Processing flow continue otherwise go to the Event Processing home page, search for your Student Name and click on the “Edit flow” link on the tile for your flow.
For example “EP-student1”.
-
Create a Filter node and link it to your event source. Create a filter node by dragging one onto the canvas. You can find this in the “Processors” section of the left panel. Click and drag from the small gray dot on the event source to the matching dot on the filter node. Hover over the node and select the pen icon to edit the flow.
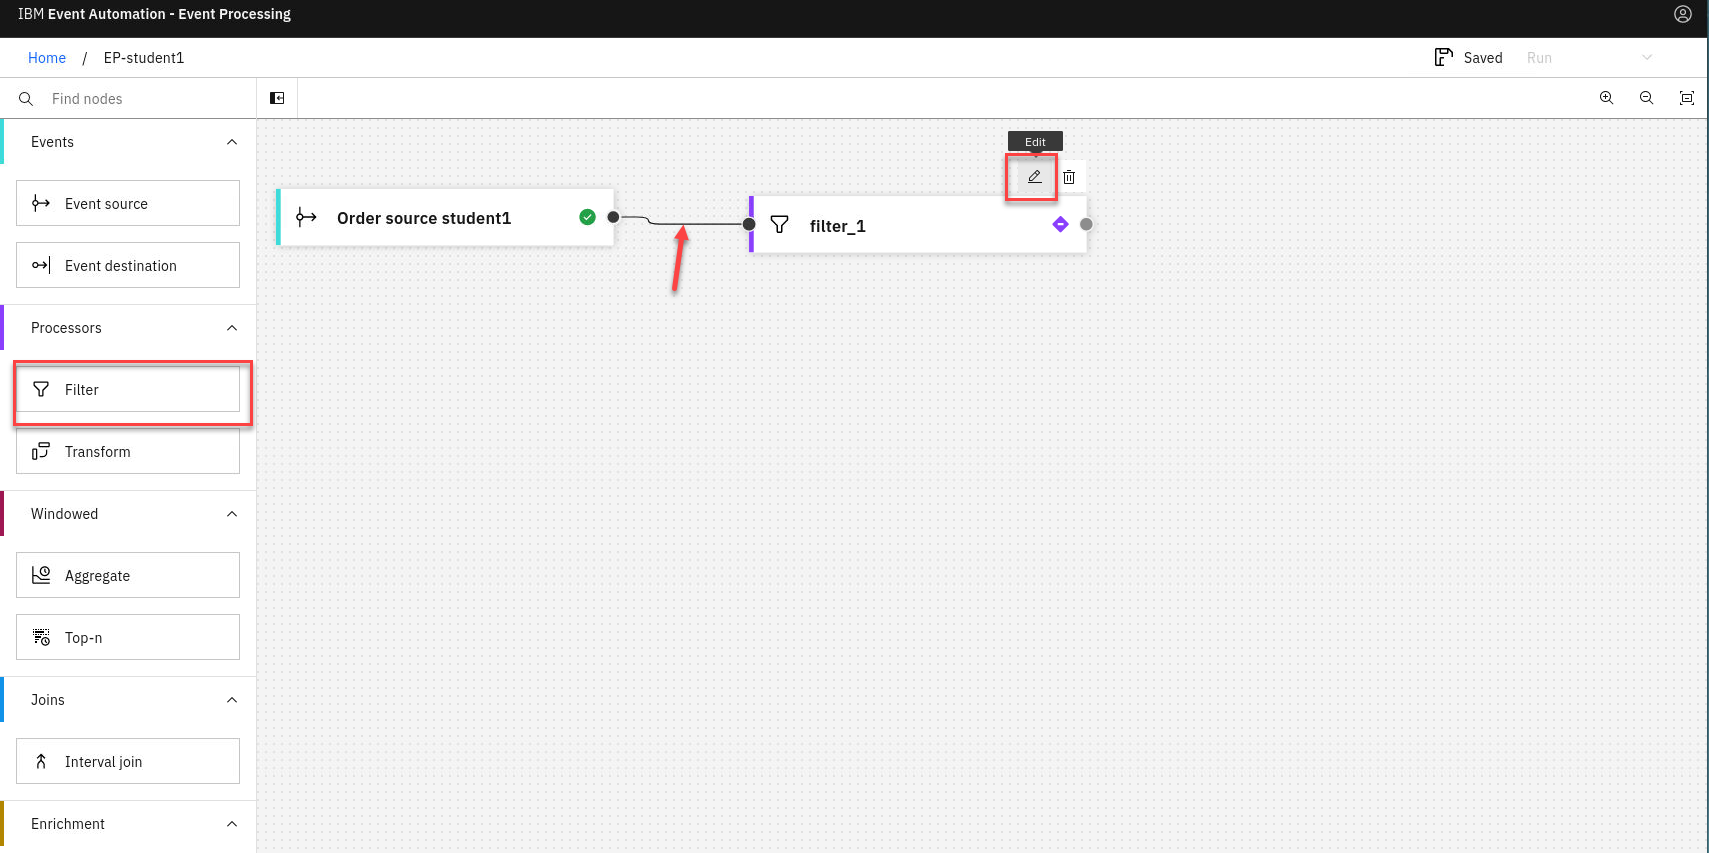
Note: You can add a node onto the canvas and automatically connect it to the last node added by double-clicking it in the palette.
-
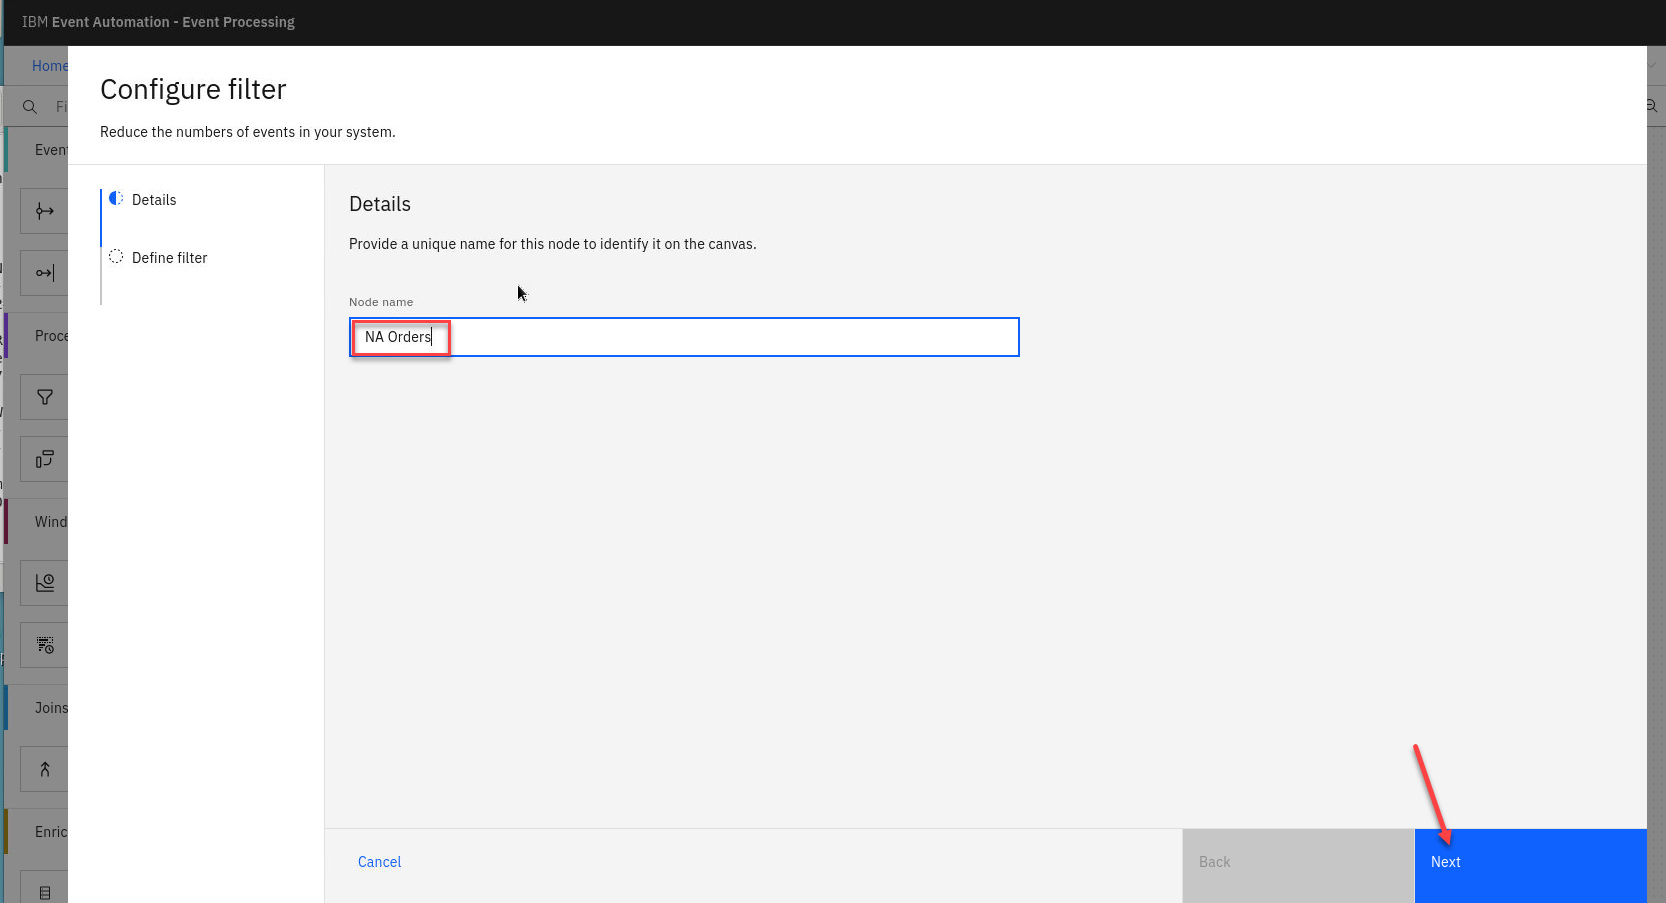
Give the filter node a name that describes the events it should identify: NA orders
Click Next
-
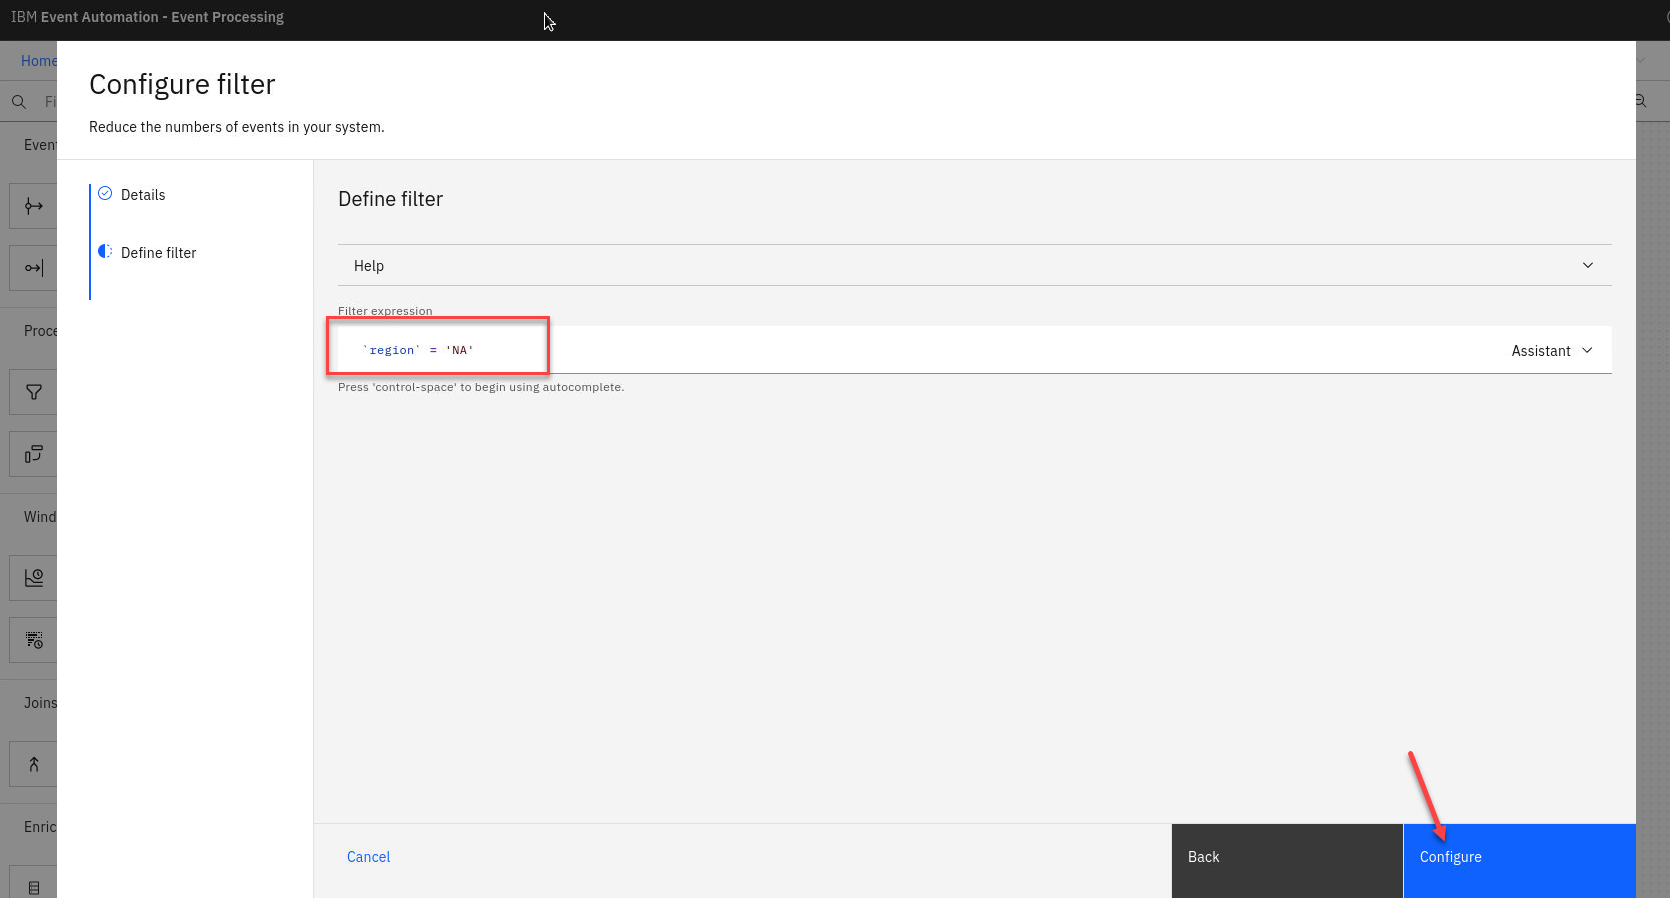
Use the assistant to define a filter that matches events with:
region = NA
Use the drop down for the property and conditon and type in NA.
Click “Add to expression”.

-
You will now see your new expression.
Click “Configure”.
Testing the flow
The final step is to run your event processing flow and view the results.
-
Use the “Run” menu, and select Include historical to run your filter on the history of order events available on this Kafka topic.
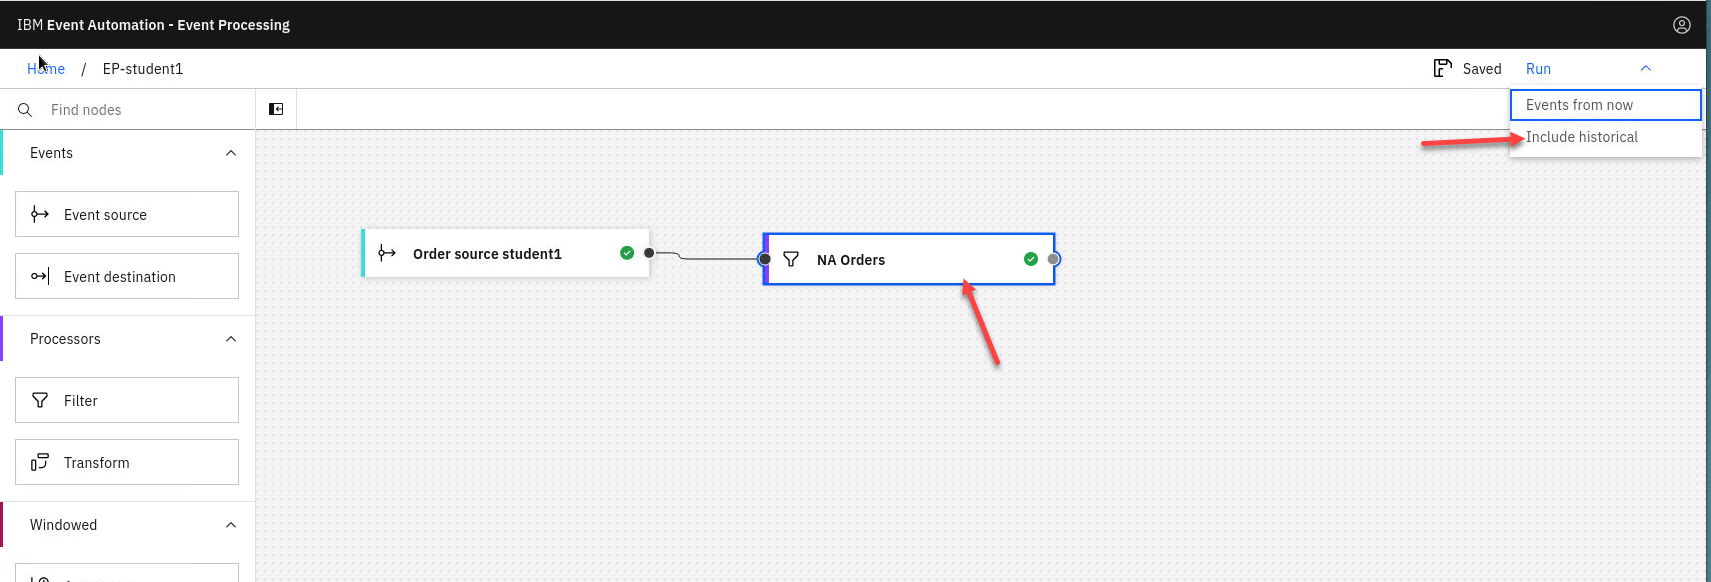
NOTE: “Include historical” is useful while you are developing your flows, as it means that you don’t need to wait for new events to be produced to the Kafka topic. You can use all of the events already on the topic to check that your flow is working the way that you want.
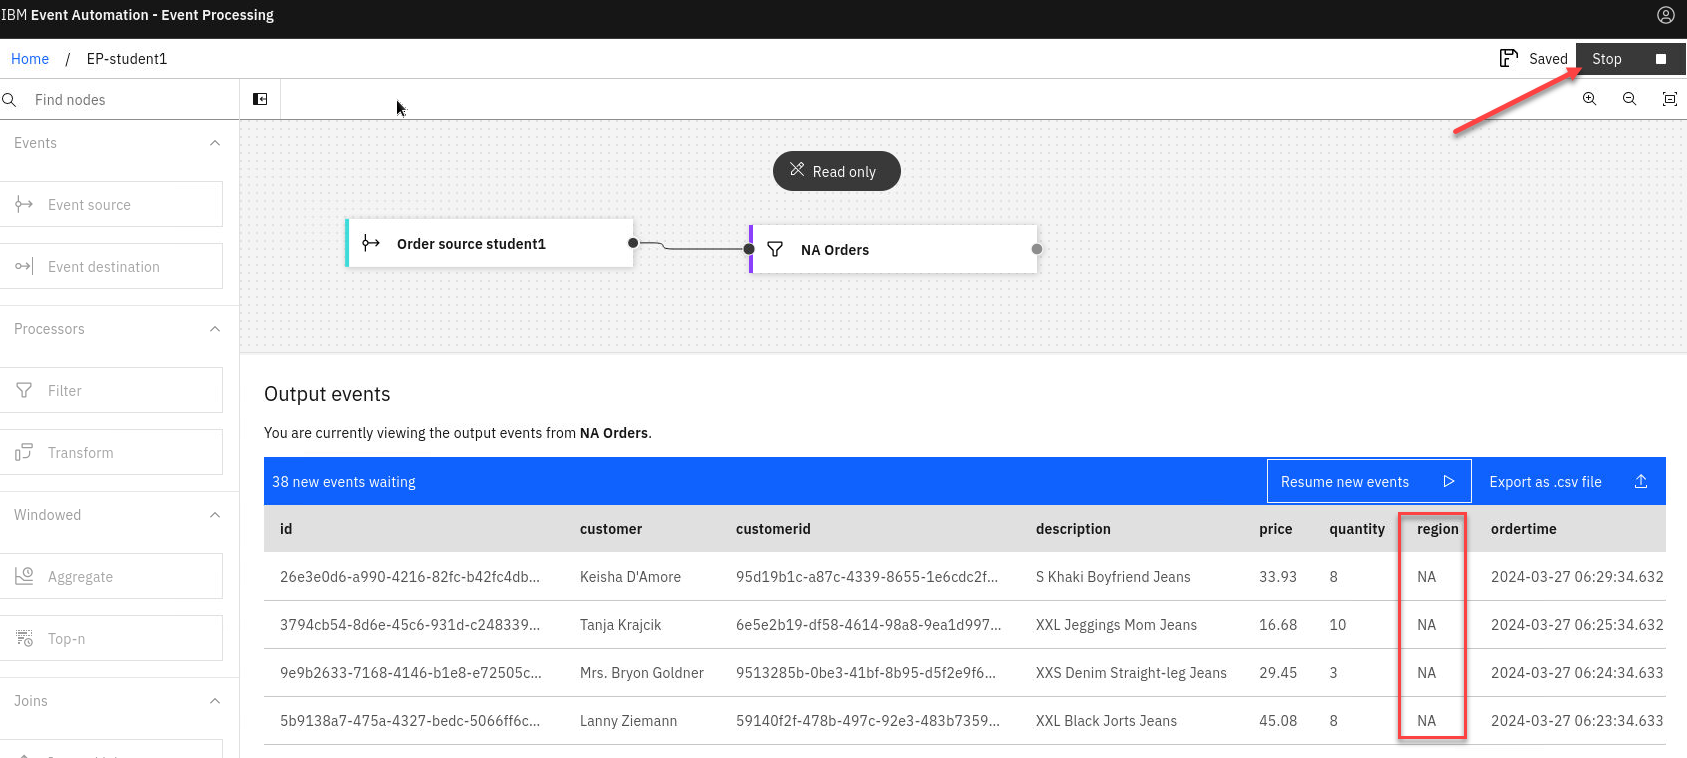
-
Click the NA orders node to see a live view of results from your filter. It is updated as new events are emitted onto the orders topic.
Note: You may see the message “Waiting for receiving the events”

-
You will see only messages from Region NA. When you have finished reviewing the results, you can stop this flow.
Recap
You used a filter node to specify a subset of events on the topic that you are interested in.